
Commercial Solar Payback: How Long Until Savings Cover Costs
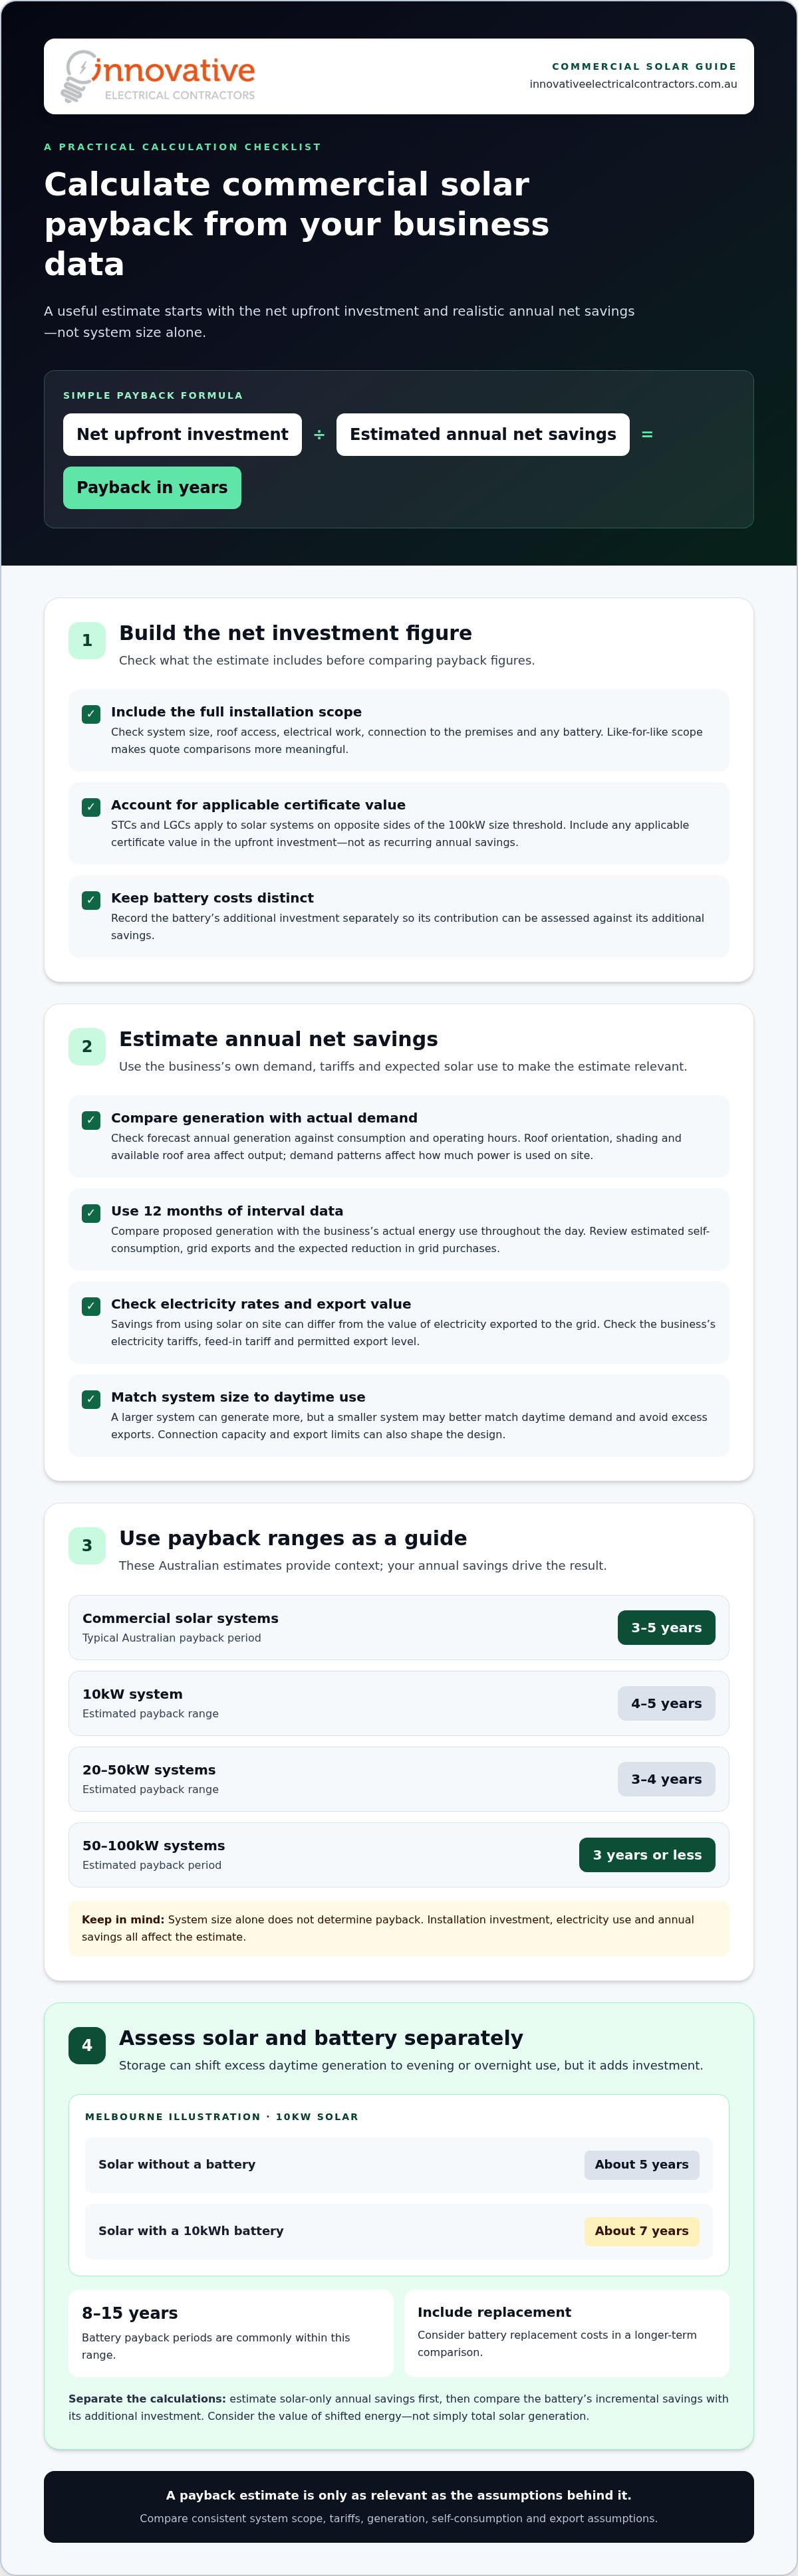
Commercial solar systems in Australia typically have a payback period of 3 to 5 years. To work out how to calculate a commercial solar payback period in 2026, divide the net upfront investment by the estimated annual net savings. The result is an estimate, shaped by your electricity costs, energy use and how much solar power your business uses on site.
Look beyond a system’s headline size: two businesses with similar roofs can see different savings if their operating hours and electricity demand do not align with solar generation. Electricity exported to the grid also affects the calculation because its value may differ from the savings from using that power on site.
This guide explains the commercial solar payback formula, the business data it requires and why self-consumption matters. You’ll also learn how to interpret an estimate for your Australian business and which factors can make payback faster or slower.
Table of Contents
What determines commercial solar system payback in Australia?
Commercial solar payback depends on the net investment, annual savings and how much generated electricity the business can use. Connection approval and export capacity vary by site, so Innovative Electrical Contractors recommends including the network’s permitted export level when estimating savings and sizing the system.
Solar installation costs
Installation cost is the upfront investment in the solar system and its connection to the premises. It matters because simple payback compares net investment with estimated annual savings. Assess the full project scope, including system size, roof access, electrical work and any battery. A like-for-like comparison helps show whether different estimates reflect genuine scope differences or different assumptions about what installation includes.
STCs and LGCs
STCs and LGCs are certificate types associated with Australian solar systems on opposite sides of the 100kW size threshold. This distinction matters because certificate treatment can affect the net investment used in a payback estimate. The Small-scale Renewable Energy Scheme provides Small-scale Technology Certificates for eligible solar installations. Account for applicable certificate value in the upfront investment, rather than treating it as recurring annual savings.
Annual generation by system size
Annual generation is the electricity a solar system produces over a year, measured in kilowatt-hours. Larger systems can generate more power, but useful output depends on the site and system design. Compare forecast generation with the business’s consumption and operating hours. Roof orientation, shading and available area affect output, while demand patterns determine how much electricity can be used directly rather than exported.
Typical commercial payback periods
Typical payback periods vary with system size, installation investment and electricity use. Across Australia, commercial solar systems typically have a payback period of 3 to 5 years. A 10kW system is estimated at 4-5 years; 20-50kW systems at 3-4 years; and 50-100kW systems can pay back in 3 years or less. These ranges help frame an estimate, but annual savings drive the result.
System sizing and roof assessment
System sizing matches expected solar output to electricity demand and usable roof space. Review roof orientation, shading, structural suitability and business consumption before comparing system capacities. A roof may fit a larger array, but a smaller system could better match daytime demand and avoid excess exports. Connection capacity and export limits also shape the design by affecting how much generated electricity the business can use or send to the grid.
Is Solar Worth It for Australian Businesses?
Compare quotes using the same system size, equipment scope, tariffs and savings assumptions. Check estimated generation against 12 months of business interval data, and account for export limits because they can restrict surplus electricity sent to the grid.
A battery stores excess solar electricity for use after generation falls, but the added investment changes payback. Assess solar-only and solar-plus-battery scenarios separately, including any relevant incentive and future battery replacement.
Payback examples with and without batteries
A payback example compares net upfront investment with estimated annual savings. This shows whether adding storage changes the financial case for your business. A Melbourne illustration estimates about five years for a 10kW solar system without a battery, compared with about seven years for a 10kW system paired with a 10kWh battery.
These estimates show why a battery should not be treated as free extra capacity. It can shift excess daytime generation to evening or overnight use, when the business may otherwise buy grid electricity. But weigh the added investment against the value of that shifted energy, not simply total solar generation.
Keep the calculations separate. First estimate annual savings from solar alone; then calculate the incremental savings from storage and compare them with its additional investment. Battery payback periods are commonly 8 to 15 years, while solar panels can continue generating through that period. Battery replacement may also fall within the asset’s financial life, so include it in a longer-term comparison.
Checking solar quotes and savings estimates
A like-for-like quote comparison uses consistent assumptions about system capacity, battery inclusion, installation scope and electricity tariffs. This matters because different assumptions can make one proposal appear to pay back sooner, even when expected energy use is similar.
Use 12 months of interval data to compare proposed generation with the business’s actual demand throughout the day. Check the estimated self-consumption, electricity exported, feed-in tariff and expected reduction in grid purchases. Then test whether the annual savings calculation reflects the business’s electricity rates and operating pattern.
Ask what each estimate includes in its net investment figure, including incentives and any battery. Compare expected output and savings assumptions, not just the headline payback period. If an export limit restricts surplus generation, a proposal that assumes unrestricted exports may overstate savings. Storage can use some excess later, but include its added cost and charging pattern in the same comparison.
For a separate battery assessment, compare its additional annual savings with its incremental investment. Include the value of evening and overnight electricity it can supply, alongside replacement costs over its expected service life. This makes the battery’s contribution clear instead of blending it into the solar system’s payback estimate.
Electricity prices and business energy consumption
Electricity prices shape the value of solar power used on site and exported. Annual consumption, daytime demand and panel output also affect projected savings.
Payback estimates can change if tariffs, export rates, operating hours or generation differ from the assumptions. Account for these risks rather than treating a single forecast as fixed.
Electricity prices and feed-in tariffs
Electricity prices are charges for grid power, while feed-in tariffs credit solar electricity exported to the grid. Both affect projected savings, but they value each kilowatt-hour differently.
Feed-in tariffs vary by retailer and state, so use the rate in the business’s electricity agreement rather than assuming every exported unit earns the same amount.
For example, a business using solar during operating hours avoids buying that electricity at its applicable grid rate. Surplus generation earns the export rate instead. Keeping these values separate prevents the estimate from applying the higher retail rate to all solar output.
Bill savings and avoided grid costs
Avoided grid costs are charges a business no longer pays when solar supplies its electricity demand. They matter because on-site use can be worth more than exporting surplus generation.
A business spending A$40,000 annually on electricity could save A$24,000 per year if solar offsets 60% of its electricity costs. This example depends on the business’s consumption and tariff assumptions. It shows why savings estimates should relate to actual bills, rather than system capacity alone.
Compare daytime consumption with the solar system’s expected output. A site operating mainly in daylight may use more generation directly than one with evening-heavy demand. Any remaining grid electricity contributes to the bill, while exported power earns the applicable feed-in tariff.
Electricity prices have historically grown by 3-6% per year across Australian states. Treat this history as a sensitivity-testing input, not a guaranteed future increase. Compare a base estimate with alternative tariff assumptions to see how price changes affect annual savings.
Solar panels lose about 0.5% of production capacity each year. Account for this gradual decline across the estimate period, since lower output can reduce both avoided grid purchases and export credits. Changes to business hours or consumption can also shift results, even if panel performance follows its forecast.
Make the estimate clearer by separating savings from on-site use and export income. Apply the relevant grid rate to self-consumed electricity and the export rate to surplus generation. Then test how different tariffs, operating patterns and panel output affect the result. This makes the assumptions visible and highlights which changes have the greatest effect on projected payback.
Daytime energy use and self-consumption
Self-consumption is the share of solar electricity used on site as it is generated. For a commercial system, matching output to daytime demand can increase savings without increasing system size. A business running machinery, refrigeration or ventilation during daylight may use more generated power directly than one with mostly evening operations.
The difference in value can be substantial. Each kilowatt-hour used on site avoids buying grid power; an exported kilowatt-hour earns the applicable feed-in tariff instead. The actual value depends on the business’s tariff and export arrangement.
Compare the system’s hourly output with the site’s actual electricity demand. For example, a business might produce surplus solar around midday, then draw grid electricity later. Daily totals alone can hide this mismatch. Reviewing consumption by time shows whether the proposed system size suits operating hours and whether excess generation will be used or exported.
A worked example shows how self-consumption can affect payback: reducing the assumed rate from 45% to 25% extends the estimate to roughly 5.5 years. The system’s output has not necessarily changed; less solar electricity is displacing higher-priced grid purchases. That difference can materially alter annual savings, even with the same panels and installation.
Businesses can improve alignment by shifting flexible energy use into solar production hours. For instance, schedule suitable equipment, vehicle charging or water heating during periods of strong output. This works best when operating needs allow the change. It increases the share of solar energy used directly while reducing the amount subject to a lower export tariff.
System size should reflect both roof capacity and the site’s daytime load. A larger array can increase annual output, but not necessarily savings if production regularly exceeds demand. A smaller system may use a greater share of its generation on site. Compare options with the business’s operating schedule and tariff structure, rather than choosing capacity based on roof area alone.
Solar exports still have value, but their contribution depends on the feed-in tariff and export limit. Model self-consumption and exports separately: apply the retail electricity rate to solar power used on site and the export rate to surplus electricity. This clarifies the financial effect of load changes and shows whether shifting demand, adjusting system size or adding storage could improve the balance.
Commercial solar payback period calculation
Simple payback divides net upfront investment by estimated annual net savings. Discounted payback adjusts future savings for their timing and value, giving businesses a more detailed comparison.
For a clear estimate, calculate savings from solar used on site and exports separately. Then apply the same assumptions for system costs, incentives and energy throughout.
Simple payback calculation
Simple payback is the time it takes for cumulative annual net savings to equal the initial investment. It gives businesses a quick way to compare a solar project’s upfront cost with its expected savings.
Use this formula: net upfront investment ÷ estimated annual net savings = simple payback period. For example, an A$120,000 investment divided by A$24,000 in annual net savings gives a simple payback of five years.
The result is only as useful as its inputs. Base net investment on the amount after applicable incentives, then estimate annual savings from solar power used on site and exported. Apply the relevant electricity tariff to each portion rather than valuing all solar generation at the retail rate.
For a second illustration, A$60,000 divided by A$24,000 in annual savings produces a 2.5-year simple payback. This calculation doesn’t show the savings earned after payback, or adjust for changes over time. Treat it as a screening estimate, not a complete measure of an investment’s financial performance.
Keep the calculation consistent when comparing proposals. Use the same period, net investment definition and annual savings assumptions for each option. Different estimates of solar output, self-consumption or export income can change the result without changing the formula.
Discounted payback comparison
Discounted payback calculates how long future savings, adjusted for their value over time, take to recover the initial investment. It matters when a business wants to compare expected cash flows rather than treat each year’s savings as equally valuable.
To calculate it, apply the business’s chosen discount rate to each year’s projected net savings. Add those discounted amounts cumulatively until they equal the net upfront investment. The discount rate represents the business’s required return or cost of capital; a higher rate reduces the present value assigned to later savings.
Unlike simple payback, discounted payback recognises that savings received later have less value in today’s terms. As a result, it can take longer to reach investment recovery. The estimate also depends on projected solar generation, electricity prices and the business’s use of solar power over time.
Commercial solar assessments may also compare net present value or internal rate of return. These methods consider cash flows beyond the payback point, showing the project’s wider financial contribution. Use simple payback for a quick comparison, then assess discounted cash flows for a fuller investment view.
For a project-specific estimate, discuss commercial solar installation options alongside your business’s energy profile.
Innovative Electrical Contractors: Commercial Electrical
Innovative Electrical Contractors provides Commercial Electrical and Solar & Battery services for businesses considering a solar investment. Turn to the team when you’re ready to move from a payback estimate to a system designed around your site’s electricity use, daytime demand and installation requirements.
A clear picture of your consumption and operating pattern helps shape decisions about system size and battery options. Innovative Electrical Contractors also provides Electrical Services and off-grid solar, battery and generator installations to support different business energy needs.
Bring your priorities and energy-use information to the discussion, then explore a practical solar solution for your premises. Contact Innovative Electrical Contractors to discuss your commercial solar project.
Turn your solar estimate into a confident next step
A payback estimate is most useful when it informs a practical decision. Before committing, consider how upcoming changes to shifts, equipment or operating hours could affect energy demand. A system should suit the way your business plans to run, not just its current electricity profile.
Use your calculation as a starting point for a broader discussion about project priorities and electrical requirements. If you’re refining how to calculate a commercial solar payback period in 2026, keep your assumptions visible and update them when your business plans change. That makes it easier to revisit the investment case over time.
Innovative Electrical Contractors provides Commercial Electrical, Electrical Services, and off-grid solar, battery and generator installations. Discuss your business requirements to connect the payback estimate with a suitable project scope.
Plan your commercial solar project with Innovative Electrical Contractors, and take the next step with a clear view of your business needs.
Frequently Asked Questions
What is a Payback Period?
A payback period is the time a project’s savings take to recover its initial investment. For commercial solar, it is commonly expressed in years. It offers a straightforward way to compare investment options, but does not show the full financial return. Savings after break-even, operating costs and equipment replacement all affect the project’s value over time. Businesses can use payback as an initial measure, then assess the wider cash flows.
How much will solar panels save me?
Solar savings depend on your business’s electricity use, tariff, system output and how much generation is consumed on site. A business with high daytime demand may avoid more grid purchases than one operating mostly at night. To estimate potential savings, compare expected system output with consumption records and electricity bills. The value of exported electricity also affects the result because its tariff may differ from the grid rate.
How should export value and incentives be modelled?
Model exported electricity separately from solar power your business uses directly. Apply the feed-in tariff to exports and count on-site generation as avoided grid purchases. Treat applicable incentives as reductions to upfront investment, not as recurring annual savings. This makes assumptions easier to compare. For instance, a lower export rate changes the value of surplus generation, while an incentive changes the initial investment to recover.
What Happens After You Break Even?
After break-even, solar can continue lowering electricity purchases, but later savings aren’t all profit. Account for operating costs and potential component replacement when assessing the project’s ongoing value. Commercial solar systems typically last 25+ years, while a standard string inverter has an estimated life expectancy of 10-12 years. A longer-term assessment should consider both the savings earned after payback and the costs that may arise during the system’s service life.
What Can Shorten Solar Payback for Australian Businesses?
Payback can improve when a business uses more solar electricity on site during generation hours. Review operating schedules and shift flexible energy use, such as equipment charging, into suitable daylight periods. Right-sizing the array can also help avoid producing more surplus power than the business can use or export effectively. Battery storage may shift some generation for later use, so compare its added investment with the value of that energy.
How is commercial solar payback period calculated in Australia?
Divide the net upfront investment by estimated annual net savings to calculate simple payback. For example, an A$120,000 investment and A$24,000 in annual savings produce a five-year estimate. To calculate a commercial solar payback period for 2026, use the business’s own electricity tariffs, consumption and export income. Apply relevant incentives to the investment figure, and keep any battery costs and savings distinct from the solar-only calculation.
What are typical commercial solar system costs per kW in Australia in 2026?
Commercial solar costs per kW vary with system size, site conditions and installation scope. Roof access, electrical work, grid connection requirements and battery inclusion can affect total project costs. Incentives can also change the net investment. For a useful comparison, assess proposals with the same system capacity and inclusions, and distinguish total installation cost from the amount remaining after applicable incentives.
How do commercial electricity tariffs, demand charges and feed-in tariffs affect solar payback?
Electricity tariffs determine the cost of grid power, while feed-in tariffs value surplus solar sent to the grid. Demand charges may also affect bills when based on peak grid demand. Solar reduces those charges only if generation lowers the relevant peak under the business’s tariff structure. Review electricity bills alongside interval data to see whether solar output aligns with peak demand, rather than assuming every bill component falls equally.


Comments